

What is supply?
Supply is an economic concept that refers to the total amount of a specific good or service that producers can offer at a given price. It represents the relationship between the price of a good or service and the quantity that producers are willing to produce and supply to the market.
Fundamentally, the law of supply states that keeping all else constant, the supply of a good or service will increase if its price increases, as firms look to maximize profits. Conversely, if the price of a good or service falls, the quantity supplied will decrease. This principle keeps the market in equilibrium.
Understanding Supply
The concept of supply in economics is wide and complex, with many mathematical formulas, applications, and contributing factors. Supply can refer to anything that is demanded by consumers and provided in the economy, including goods, services, and labour.
Generally, if the price of a good increases, its supply will also increase. This establishes a direct relationship between the price of an object and its supply. The law of supply governs this relationship: stating that as the price of a good or service rises, the quantity supplied by producers also increases, assuming that all other factors remain constant. Conversely, if the price decreases, the quantity supplied decreases as well. This relationship is based on the principle that higher prices incentivize producers to supply more goods or services because it becomes more profitable for them to do so.
Several factors influence supply, including production costs, technological advancements, input prices (such as raw materials and labour), expectations about future prices, government policies (such as taxes and regulations), and the number of producers operating in the market.
Understanding supply is essential for analyzing market behaviour, setting prices, forecasting production levels, and assessing the overall functioning of an economy.
Supply is represented in microeconomics by several mathematical formulas. The supply function and equation express the relationship between supply and the factors that affect it. A wealth of information can be gleaned from a supply curve, such as movements (caused by a change in price), shifts (caused by a change unrelated to price), and price elasticity.
Calculating Supply: The Supply Equation
The supply equation represents the supply of an item at any given price:
Qs = x + yP
where:
Qs = quantity supplied
x = A variable that depicts “quantity intercept.”
y = A variable that depicts the price coefficient of the supply. How responsive producers are to price changes. Put differently, it is the change in quantity divided by the change in price. A higher value represents greater responsiveness of producers to changes in price
P = Price of each unit
Related Terms and Concepts
Demand
Demand represents the consumer’s desire to obtain a product. When a broad set of consumers are more willing to buy a product or service, that product or service is said to have higher demand.
Demand is influenced by price. However, unlike supply, demand is inversely related to price. More specifically, if the price of a good increases, its demand will fall.
The Supply Curve
The supply curve is a graphic representation of the relationship between the price of an item and the quantity the market will supply at that price. All else equal, the supply curve is upward sloping, i.e. as the price (y-axis) of goods increases, more market participants will be willing to supply (x-axis)
Equilibrium
Market equilibrium is achieved when both the demand and supply of a good are equal. It is the price point where the supply curve and demand curve intersect. At equilibrium, the market will agree on the given market price.
Monopoly
A monopoly is a market condition where a single seller dominates the market supply. Often, government regulations are introduced in an attempt to control market conditions and ensure fair competition. This allows consumers to purchase goods at a fair price instead of having a single supplier dictating the market price.
Competition
To avoid a monopoly, there must be competition in the market. This means different businesses must supply similar goods to consumers, and consumers then choose which items to buy. Competition is necessary to breed price competition and innovation and to ensure that a single market participant doesn’t have too much power over consumers.
Oversupply
Oversupply occurs when there is an excessive supply of a good relative to its demand. For example, a bumper crop could lead to a substantial increase in the supply of wheat, while the demand may not have risen proportionately. In this case, the price will typically decrease.
Scarcity
Scarcity is the opposite of oversupply. For instance, the supply will fall in a year with low crop harvest due to inclement weather. This will make it challenging for consumers to purchase the crop, and therefore, the cost of the crop will increase.
Supply elasticity
Price elasticity measures how the supply of goods will respond to a change in its price. An elastic supply means that a small change in market prices will result in a relatively large change in the availability of that good. An inelastic supply refers to goods whose supply does not change significantly in response to price changes.
Consider a case where a surge in demand for a product causes the price to increase by 10%. Suppliers of that product may start producing more of it to take advantage of higher profits. If the supply of the products increases by more than 10%, the good are considered elastic. If the supply increase is less than 10%, it is considered relatively inelastic.
Elasticity can be determined by the slope of the supply function. A steep supply curve indicates a greater response to price changes, indicating an elastic supply. If the supply curve is flat, then supply is inelastic.
On the same lines, if the supply curve is vertical, the good is perfectly inelastic, and if the supply curve is horizontal, the good is perfectly elastic.
The Supply Curve
A supply curve is a visual representation of the law of supply, and graphically displays the direct relationship between quantity supplied and price. Essentially, the supply curve shows the change in the supply of a good or service resulting from a change in its price.
On the supply curve, the vertical axis, or the y-axis, denotes price, while the horizontal axis, or the x-axis, denotes quantity supplied.
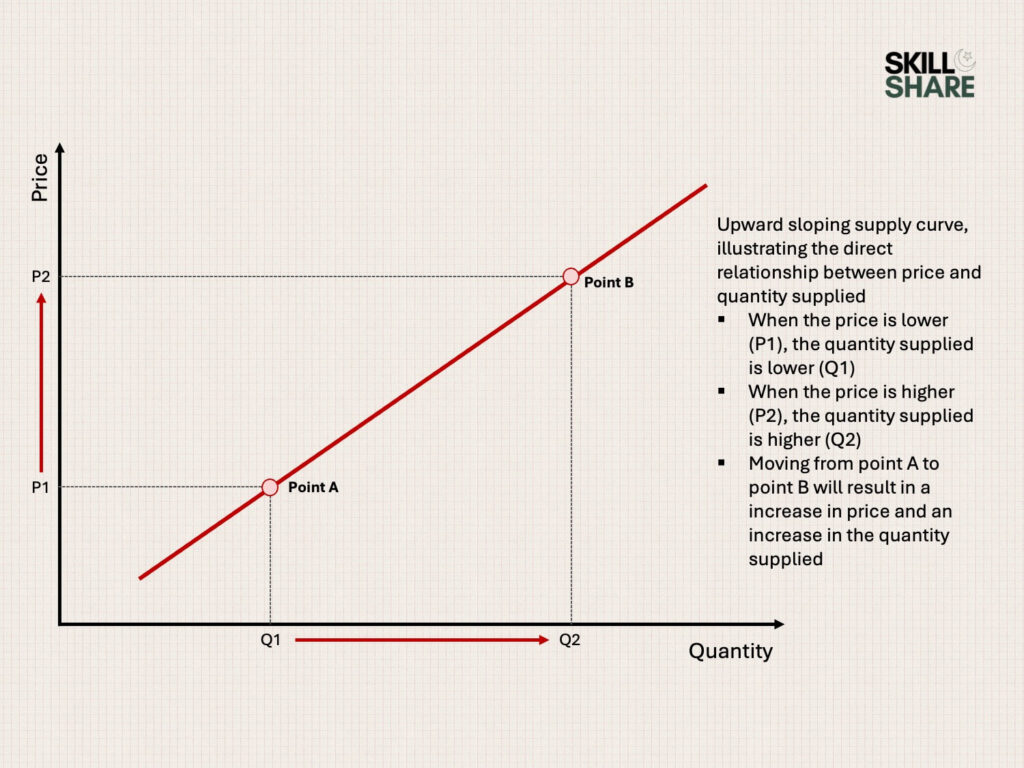
Once plotted, the supply curve will be upward sloping, from left to right. As prices increase, suppliers will be incentivized to increase the supply of goods. Conversely, as prices fall, producers will be less inclined to produce the goods.
In contrast, the demand curve is downward-sloping. As prices fall, consumers demand more of the good or service.
Movement Along a Supply Curve
When the price of a product changes, the equilibrium point along the existing supply curve will simply change. For example, imagine the current level of supply for a good whose price is $100. In case the product’s price decreases to $90, the level of supply can be found by moving along the existing supply curve down to when the price is $90.
Shift in Supply Curve
When a non-price determinant has an external impact on supply, the entire supply curve will shift. For example, consider technological innovations that influence the quantity of goods that can be produced. Instead of simply being a different point along an existing curve, the entire supply curve will move, and a new equilibrium point will exist on the new line. In case the supply is to increase, the supply curve will shift to the right. On the other hand, when the result is a decrease in supply, the supply curve will shift to the left.
KEY TAKEAWAYS
- Supply is the basic economic concept that describes the total amount of a specific good provided to the market for consumption.
- Supply is heavily correlated to demand, and the two concepts are intertwined to create market equilibrium which defines the availability of goods in the market and the prices they are sold for.
- Supply is graphically depicted, and the supply curve maps the relationship between price and quantity by being shown as an upward-sloping line.
- Supply is determined by market demand, cost constraints, consumer preferences, and government policy.
- Supply is often broken into short-term and long-term supply, though there are other types of supply.