
Strategy consulting slide decks by consulting firms like McKinsey, Bain, or BCG are quite distinctive. They have a very coherent flow of information, everything is backed up with data presented through graphs and charts, and overall, the presentation seems more credible and convincing. There are some very defined fundamentals and practices that consulting firms have established that help them create effective slide decks.
There are two important components of a compelling strategy consulting slide deck:
- The thinking: This includes comprehensive problem definition, rigorous analysis, data synthesis, and insight generation that happen before you begin. Without this, even the most well-designed strategy presentation lacks impact
- The presentation. This is the distinctive, structured, and clear way that strategy consultants build their slide decks
In this slide-making guide, we will discuss both of those things. First, we will discuss how to structure your strategy consulting slide deck, define your objectives, and craft a compelling storyline.
Next, we will discuss the best practices for creating consulting-style presentations that MBB consultants use when preparing their slide decks.
By the end of this guide, you’ll have the ability to craft a compelling strategy consulting slide decks with a clear storyline and effective messaging, that will lead your audience to the desired conclusion.
Structure your strategy consulting slide deck
Before we delve into the details of creating strategy consulting slide decks, it is important to understand how to structure your presentation.
Almost all strategy consulting slide decks use a consistent framework known as the Pyramid Principle. The Pyramid Principle was developed by Barbara Minto, a McKinsey consultant, and is used not only at McKinsey but at almost all of the top consulting firms.
The McKinsey Pyramid Principle suggests that you begin with the answer or conclusion. Then present the arguments that led to that conclusion as well as the data that supports them.
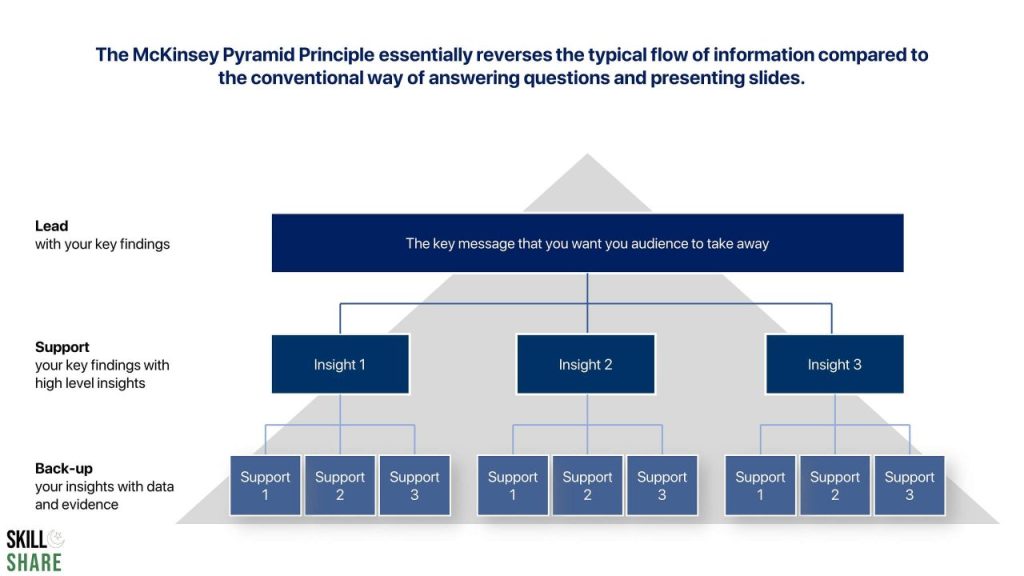
According to Minto, there are three components to a well-constructed slide deck:
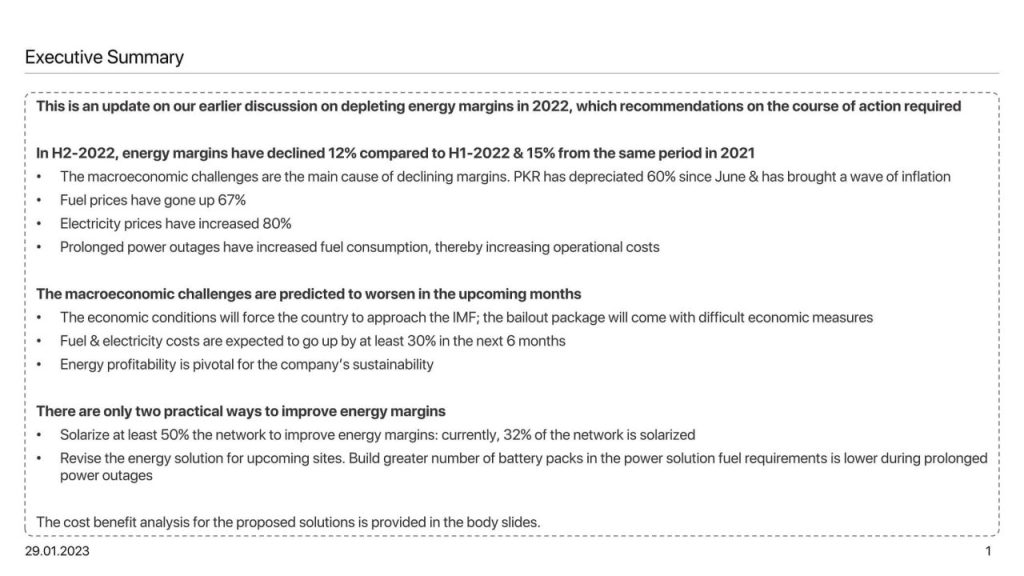
- The executive summary: Provides the reader with a summary of your entire presentation. It briefly mentions the problem and then mentions your argument and recommendations within your slide deck. This serves two purposes, essentially:
- It sets up the audience for what is to come and gives them a quick idea at a glance
- It helps the readers who are more interested in the ‘so what’ than the detailed analysis
- The body slides: This is the main chunk of your presentation. It illustrates the analysis that supports each claim you make in your slide deck’s argument
- The Conclusion Slides: This section clearly outlines the key implications of your slide deck and also includes the ‘next steps,’ or the recommendations that you want to make through your presentation
In this presentation guide, we will walk you through each of these sections. But before that, we will start by setting the objectives for strategy consulting slide decks and discussing how to craft the argument and the storyline.
Define the objective of your strategy consulting slide decks
First and foremost, you should understand that the purpose of your slide deck is not to show off the things you know, how great you are at analysis, or how beautifully you can design and present your slides.
Instead, the purpose of your strategy consulting slide deck is to persuade your audience and lead them to an objective. Therefore, you need to be absolutely clear about the objective before you start building your slide deck. This is crucial for several reasons:
- It helps you keep your research and analysis focused on things that are relevant to your objective
- It helps you quickly assess your content by testing whether it is sufficient to achieve your objective
- It helps set the tone and positioning of the messages in your slides
- Your objective can take many forms: for instance, it could simply be to inform your audience of a certain message, to gain endorsement for a decision, or to achieve a specific action or next step
Thus, you must ensure that the objective is clear and agreed upon. All the work that you’re about to do is guided by your objective.
Craft the argument and storyline
Once you have defined the objective of your strategy consulting slide deck, you need to decide the argument and storyline that lead to your objective.
Your arguments will naturally appear on your consulting slide deck as insights gathered during the research and analysis phases. As you conduct research and perform analysis, you will draw certain insights, which you will present on your slides, supported visually with data using graphs and charts. However, it is now your job to translate the arguments and insights into a compelling story that grabs the attention of your reader and communicates your argument in a clear and easy-to-understand way. This is the most important aspect of slide-making.
To do this, you may use a situation-complication-resolution (SCR) structure. This is a universal structure that is commonly used in story books, plays, films, advertisements, and more. It looks something like this:
- People are going on about their lives (situation)
- Something goes wrong and must be fixed because of its importance (complication)
- They fix the problem, and things go back to normal (resolution)
Storytelling through presentations should also follow the same structure. But in the context of your slide deck, your storyline will look something like this:
- This thing is important (situation)
- There is a problem with this thing (complication)
- We must respond, and this is how (resolution)
The Horizontal and Vertical Logic
The storyline for your presentation shouldn’t be designed on PowerPoint. In fact, you should not even open up PowerPoint until you have defined your storyline and are completely satisfied with it.
Instead of jumping into PowerPoint, you start by writing out your storyline in a text document using the dot-dash structure. Once you translate it on PowerPoint, it will form what we call vertical and horizontal logic.
The dot-dash storyline clearly articulates your slide deck’s argument:
- The “dot” refers to the top-level insights that make up your argument
- The “dash” refers to the data and analysis that support your insight
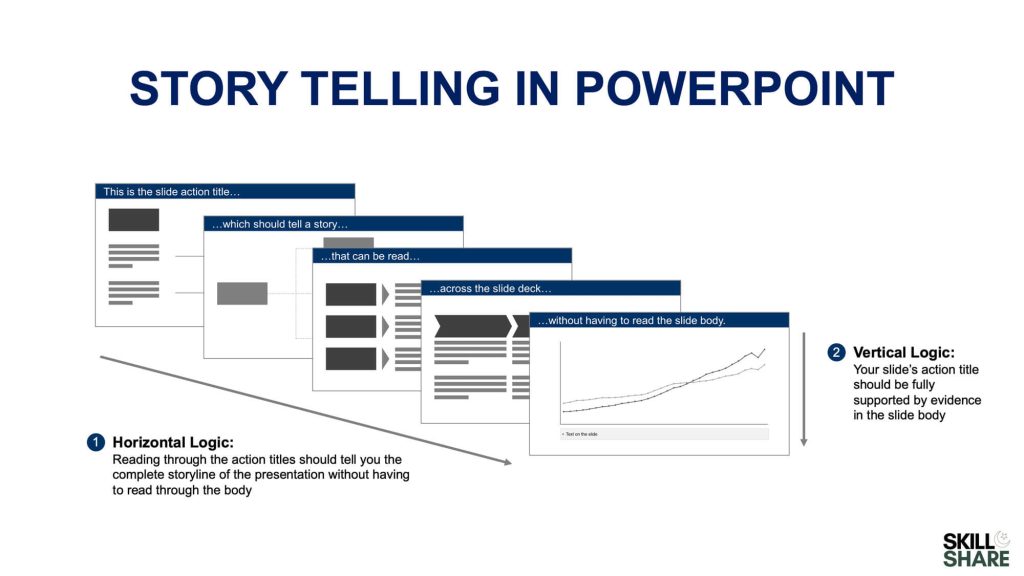
When mapped onto strategy consulting slide decks on a PowerPoint, the dot forms the horizontal logic, while the dash refers to the vertical logic:
- Horizontal logic: This means that the slide headers convey the essential points and key messages of your strategy slide deck, including the context, findings, and call to action. There should be a seamless and clear flow from one topic to another.
- Vertical logic: The idea of vertical logic is to ensure that the content given in the slide reinforces the header and that there isn’t any extra or unrelated information. Moreover, it also helps to ascertain whether a slide is valuable enough to keep in the main deck or to push to an appendix or backup. Put differently, the audience can go over the slide content (vertically) if details are required after reading the slide summary in the action title.
By writing your slide deck’s storyline in a text document, you can quickly identify any shortcomings or missing logic in your story and thus ensure that you have the data required to support each claim you make.
And once you have finalized your storyline, you can move it into PowerPoint. Your storyline should be communicated in the slide action title, as shown below:
Once you have designed the skeleton of your strategy consulting slide deck, with the storyline being communicated “horizontally” through action titles, you are ready to start building individual slides and the “vertical” flow of information through graphs, charts, and other analyses.
The body slides for strategy consulting slide decks
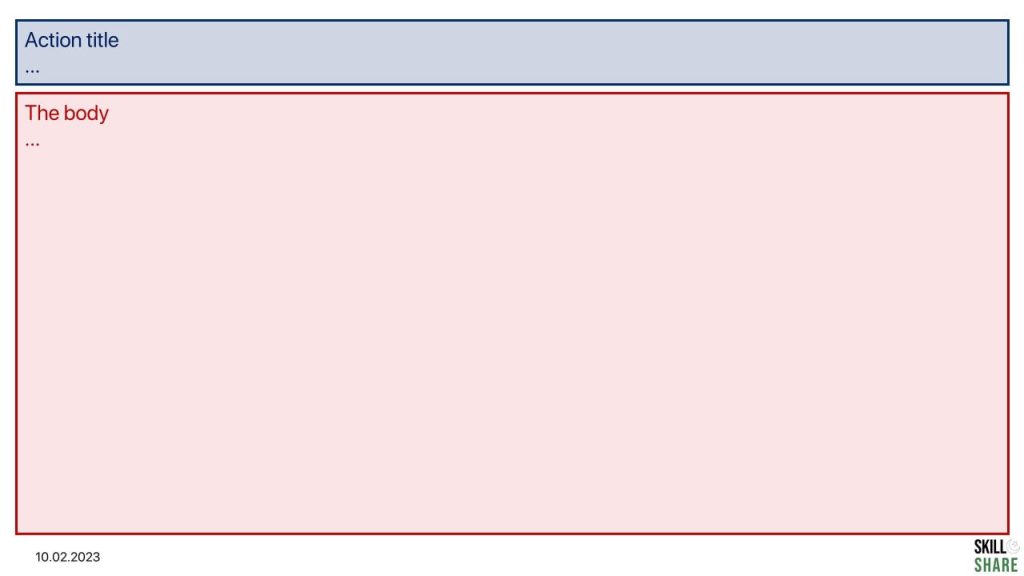
Before you jump into building individual slides, it is important to understand the fundamental principles of slide writing. Each well-designed strategy consulting slide has two main components:
The top line (also called the action title): This is the slide header and should be written as an action title that communicates the implication or ‘so what’ of the slide. Ideally, an action title serves as a punchline and provides the key message of the content of the slide.
The slide body: The content of your slide. This should include different graphs, charts, and infographics to back up and support your assertion in the action title.
There is a close relationship between the slide lead-in and the slide body. And this relationship is best explained by the Golden Rule of slide building.
The Golden Rule of slide building is:
One slide, one message, with an action title, backed by data in the form of a chart or a graph.
In other words, each slide should only communicate one insight. That insight should be fully explained in words in the action title, which should be fully supported by data in the slide body. This data should, in fact, be presented visually using a graph or a chart, and if not, then as a table
Additionally, make sure that there is nothing in the action title that is not in the slide body, otherwise, it will be difficult for the audience to hold on to that thought and consume the idea.
Data, charts, and other quantitative slides
What you say and present will naturally be more compelling when substantiated with data or supported by credible research. In other words, there must be quantitative and qualitative evidence to support your arguments. Therefore, whenever possible, always complement your quantitative slides with some qualitative research.
However, when creating strategy consulting slide decks, don’t go overboard with data visualizations. Sometimes it can be tempting to show off your technical skills by choosing the most complex visualization techniques. However, this can be counter-productive. What you’re trying to present must be, first, understandable to the audience, and second, understandable easily so they can absorb whatever is being presented.
Thus, you should always choose the simplest chart to demonstrate your insight. Since it can be tricky to determine which chart to use, we’ve put together a detailed guide to help you choose the most appropriate chart for your data.
Text-oriented and qualitative slides
There are some insights that simply cannot be communicated with charts or data. In these cases, you can simply present your arguments and add some infographics or icons, or just add matrices. Unlike chart-based slides, there are no simple guides for text and conceptual slides. Because of this, the ability to craft well-structured conceptual slides is the mark of a skilled consultant.
Surprisingly, it can be tricky to be able to communicate a qualitative insight in a clear and structured visual manner. The best way to build the skill is to practice. But you can also learn by exploring common qualitative slides used by strategy consultants.
Write the executive summary for strategy consulting slide decks
Once you are done with your slides, you must write an executive summary. The executive summary slide is the first slide in your presentation, but it is the last slide you create.
The executive summary slide fully summarizes the arguments, storyline, and supporting evidence of the body slides. Since we are done with all of our analysis and insights of our slide deck, we write the executive summary last.
Executive summary slides help the reader follow along with your slide deck. There are a few main benefits to writing an executive summary:
- It provides context for the reader for what is going to be discussed in your slide deck and why it is important
- It communicates the high-level argument before the reader delves into the body of the slide deck and its details
- It can act as a “reference point” or a map that the reader can refer back to if they lose the line of argument
Here are some key elements that you can include in your executive summary slide:
- A brief overview of the purpose of the presentation
- A summary of the main findings and your conclusions and recommendations
- Key recommendations and action points
- A call to action, guiding the readers on the next step
Review your strategy consulting slide decks
Now that you’re done creating all your slides and writing your executive summary, it is time to review and finalize your slide deck.
There are a few things that you must ensure when you review your slide deck:
Charts: Check that your charts are comprehensively labeled, including chart titles, axis labels, units, time periods, etc.
Text: Review your slide text, including your action titles, and ensure that you make your argument as precise and concise as possible.
Slide consistency: Review your slides and ensure that the formatting across the slides is consistent. This includes font type, size, and colours.
Reviewing your charts and visualizations
When you look closely at the charts on your strategy consulting slide deck, you’ll be surprised by the amount of detail it contains. Hence, it is quite easy to forget to include key information.
Some examples of common charting mistakes include missing chart titles, labels, axes, units, dates, and legends. You should also consider how you highlight the implications of your charts.
To make this easier, you should use a charting checklist to methodically cross-reference your chart with best practices. We have prepared a detailed guide on how to format your charts to convey key insights effectively.
Refining slide text on strategy consulting slide decks
Needless to say, text is one of the most important elements of your slide deck. Not only can you use text to provide important context to support your visualizations, but also to communicate insights without data.
However, there are a few things that you must keep in mind. Foremost, most people use too many words on their slides and tend to use fancy “consulting jargon” or long, verbose explanations that are actually counter-productive and make the message obscure. Therefore, try to keep your words concise and precise, so your message is delivered effectively.
As you review your slide deck, you should review all of the text in your slides and sharpen your text by removing unnecessary words. You can also try to support your text by using icons.
Ensuring consistency across your strategy consulting slide deck
Finally, you should check for consistency across slides. The entire strategy consulting slide deck must have consistent font styles; font type, size, and colour.
Start by ensuring that the formatting is consistent. For example, your slide format, spacing, fonts, and slide numbers should all be consistent across the slides.
Finally, make sure that all of your slides are consistent. The font-type, font-size, and font-colour must all be consistent across the entire strategy consulting slide deck.
Make sure the formatting is consistent first. For instance, all of your slides should have the same slide structure, spacing, fonts, and slide numbers.
And finally, make sure that all concepts are presented consistently throughout the presentation. For instance, if you’ve numbered or colored concepts a certain way, then ensure that they remain consistent throughout your slide deck.